There are several available types of reports in the Smart Content Filter dashboard. These help you to visualize and evaluate your traffic, so that you can take security measures or tweak your filtering policies.
Insights Reporting
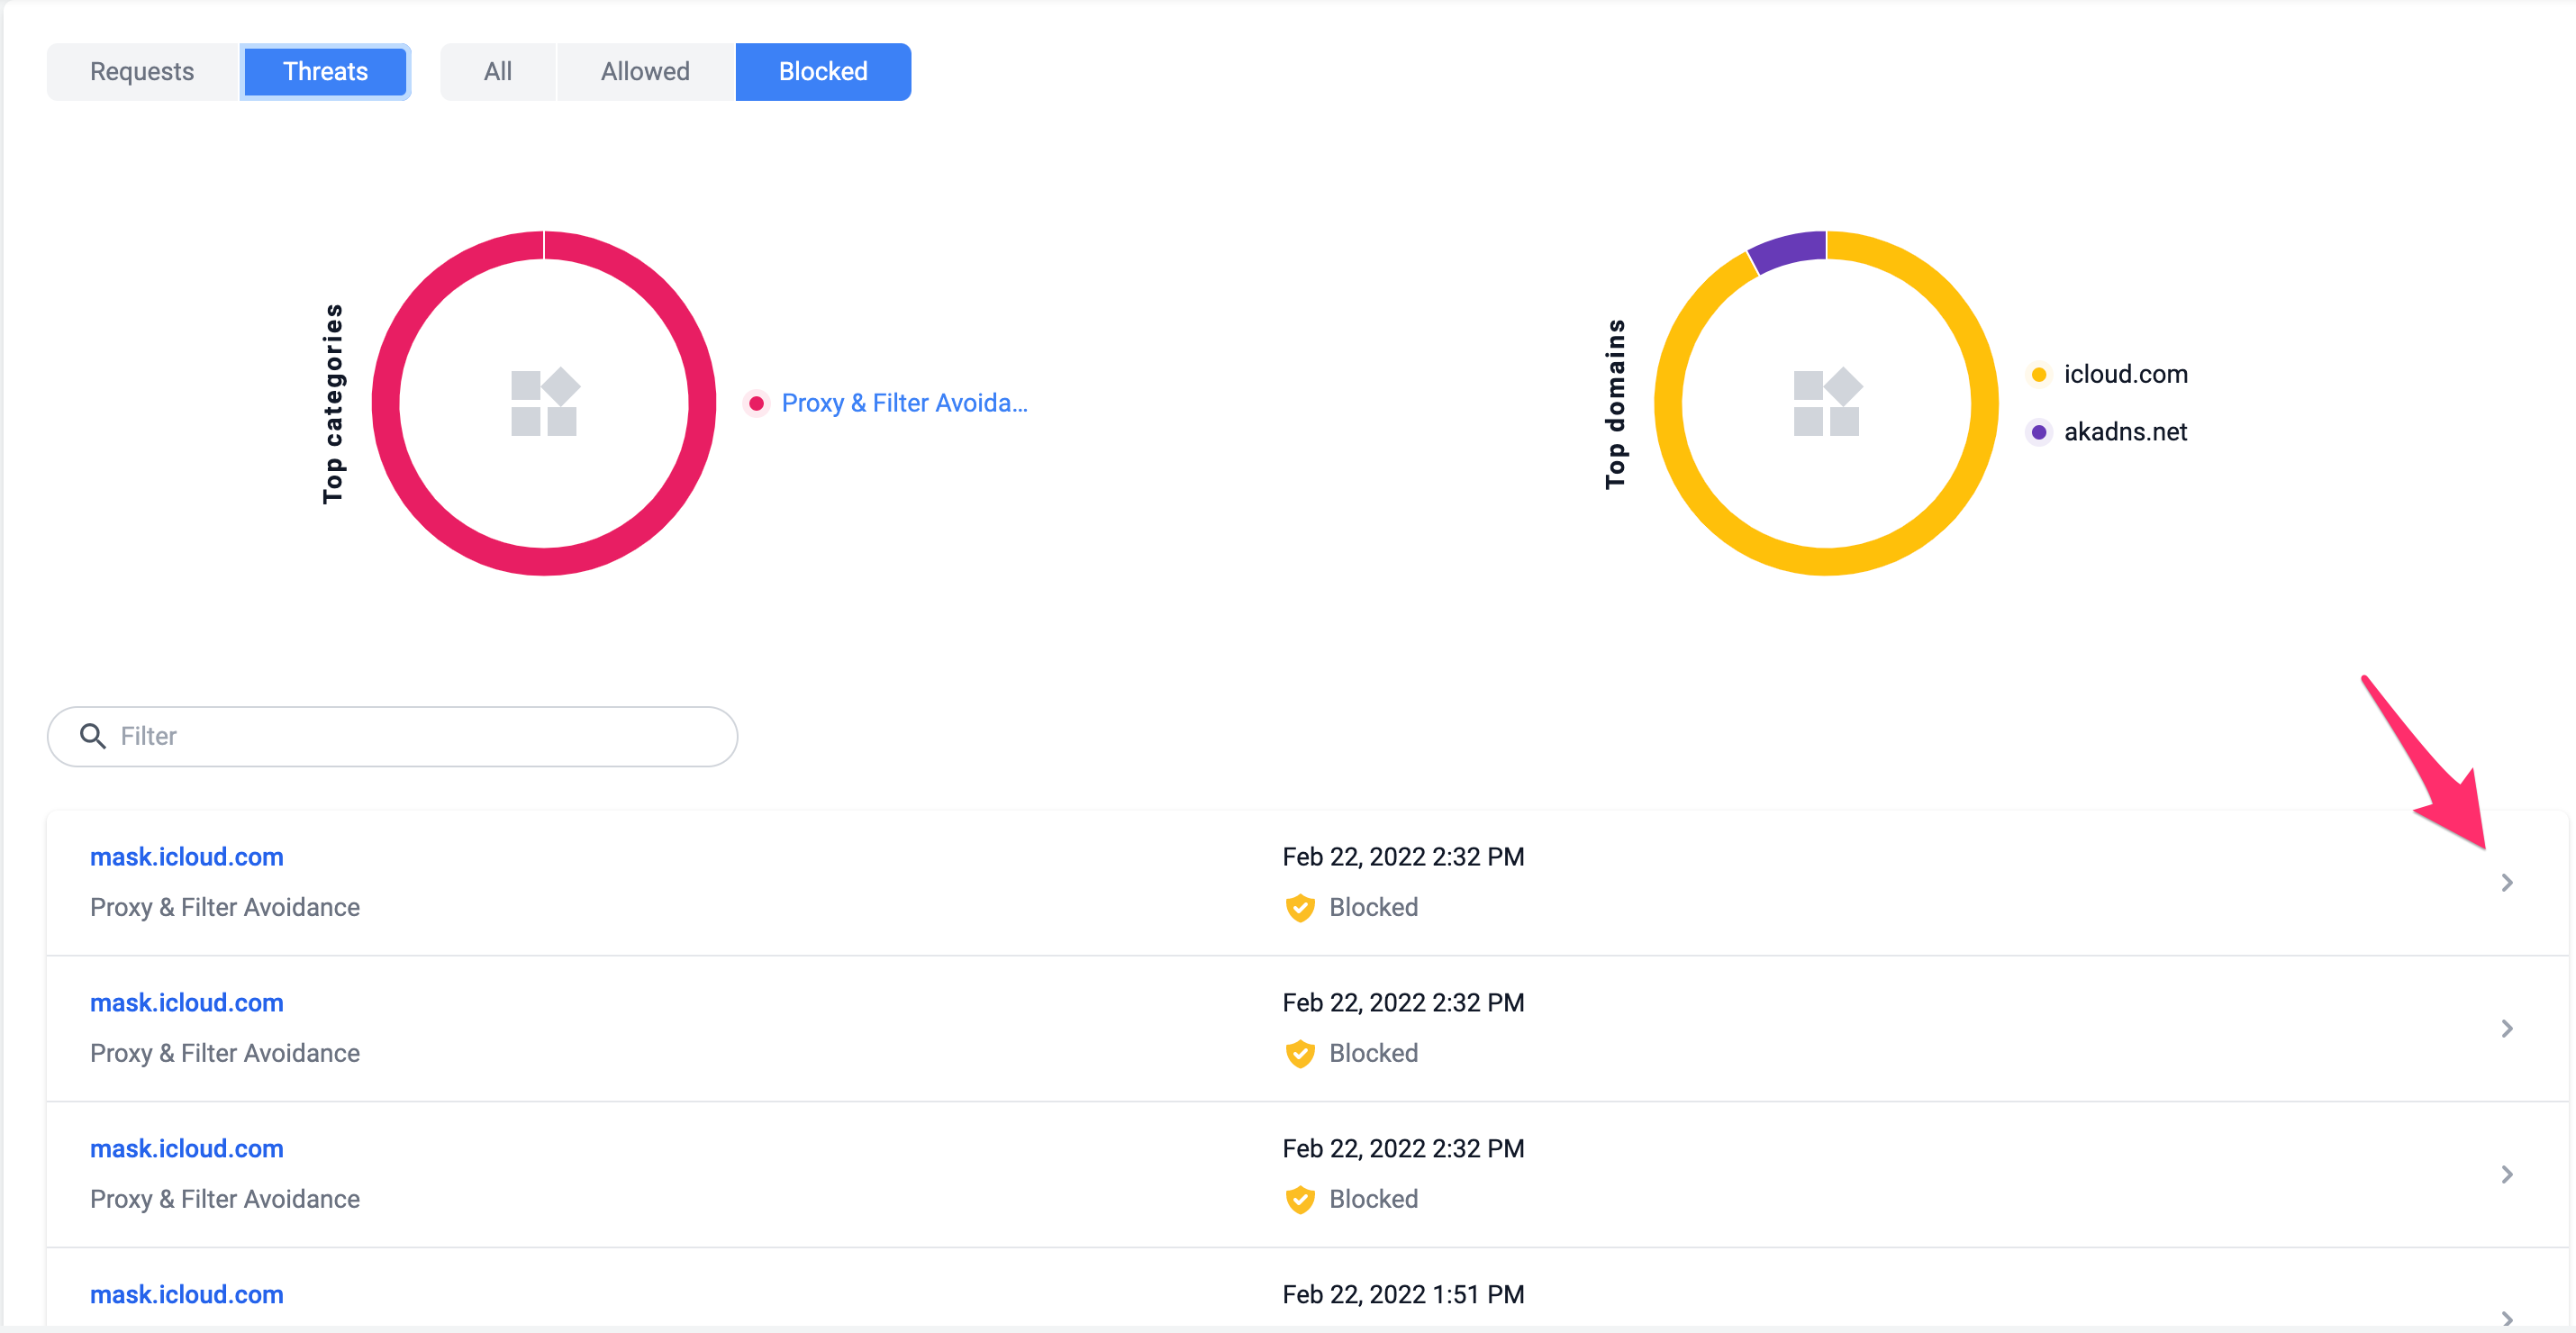
Insights is our latest reporting development. Smart Content Filter users will benefit from accurate insights into trends, and quality reporting on their network traffic and blocked threats. Insights gives customers a snapshot view of their network data while providing the ability to drill into the raw data of a query. Customers can slice and dice the data any which way they choose.
Under All requests by domain, you have the ability to filter this view by Requests/Threats/All/Allowed/Blocked. There are also additional options to break down the filtering view such as Domain, Application, Category, Collection, User, and Roaming Client. For example, when filtered by the Roaming client, you can click on the device name in the results and view all domains of your choice.
Next to those domains that appear in the results section, you can click on the right pointing arrow to reveal details on the who the user or roaming client device is that requested those details, along with their IP address, Policy, and Site name they belong to.

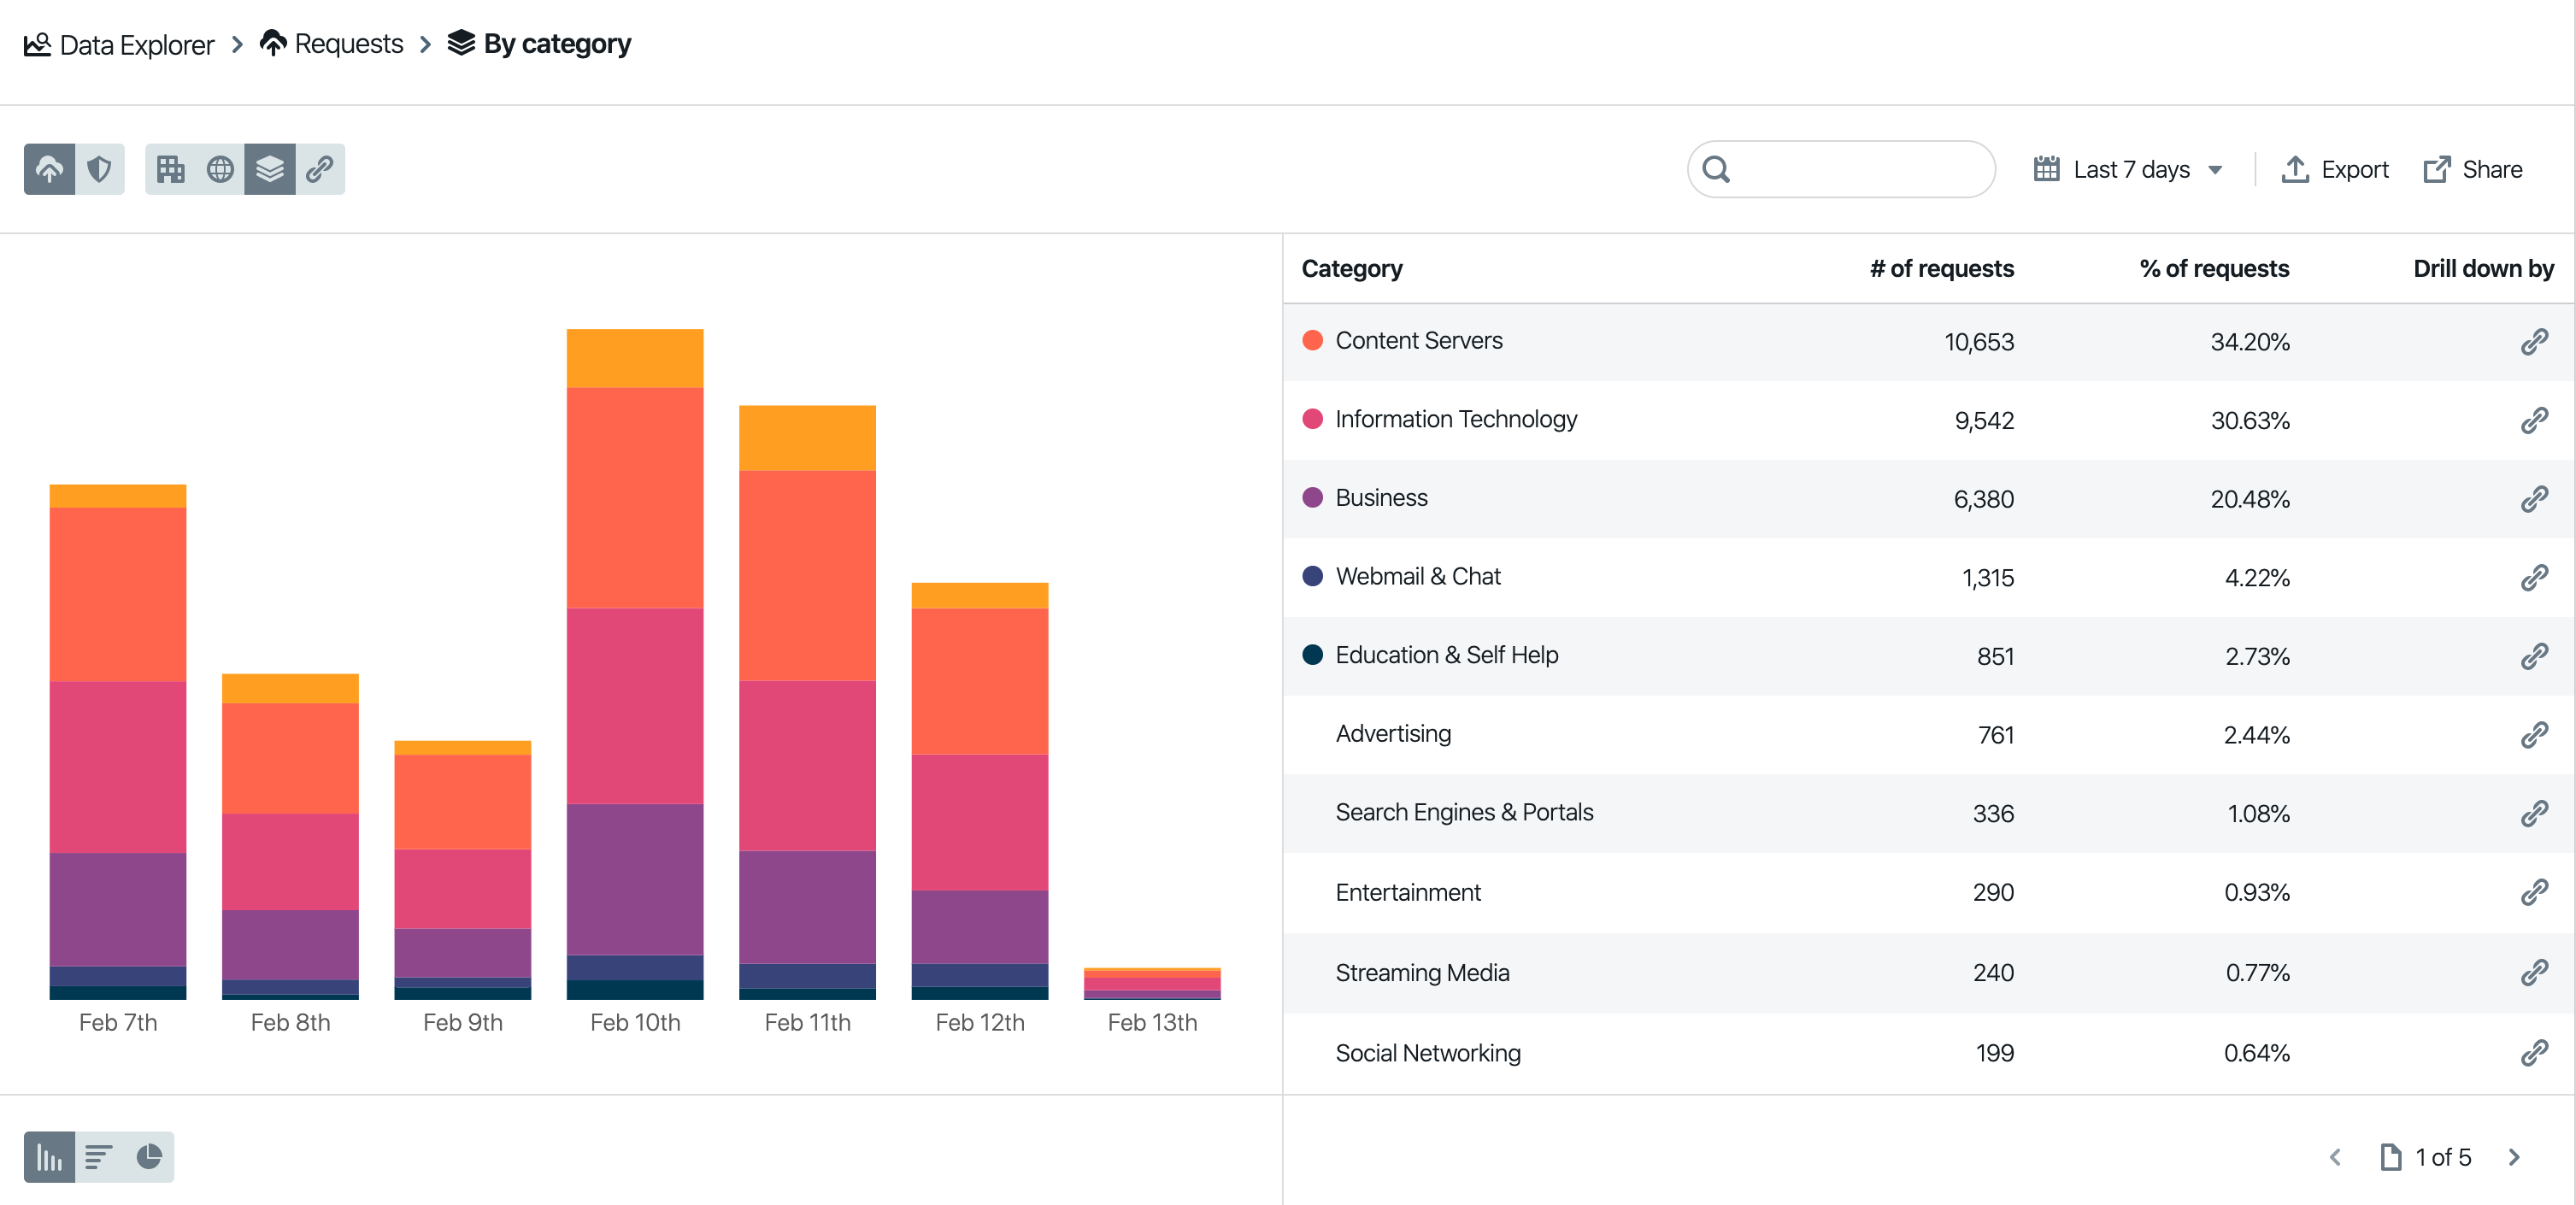
Data Explorer
This report allows you to view all data associated with your connection in a variety of different formats. A search box allows you to search for a specific Site, Category, or Domain. You may also filter the results to specific dates or date ranges and export the results to a CSV or share the link to the report with other authorized users.
AppAware Reporting
The reporting section for AppAware can be found by navigating to Reporting > AppAware. Requests can be displayed in this view over a specified period by the user. The 'Last 24 hours' is the default timestamp set on the reporting view.
You also get a detailed application view for a breakdown of the application’s requests by users, roaming clients, collections, and sites. An application’s requests can also be filtered into blocked/allowed lists, and you can observe the requests over a time-series graph with controls to adjust the time range.
AppAware reporting provides organizations with indicators that can be observed and used in taking necessary actions. These insights include:
- Top 5 applications based on request
- Top 5 categories based on request
- Total number of requests per application
- The percentage change in requests for an application in comparison to a previous time
- ….and many more
Scheduled Reports
Scheduled Reports is a Smart Content Filter feature that allows users to receive summaries of different types of DNS reports in their emails at scheduled intervals. This interval can be weekly, bi-weekly or monthly.
Scheduled reports create an automated feedback channel helping users stay up to date on DNS activities on their network and have more visibility into how Smart Content Filter is protecting them from threats and unwanted content.
Report Types
There are two report types: Requests and Threats. The Requests report type shows information about general DNS requests. The Threats report type focuses on DNS requests which could pose a threat to your organization.
Breakdown
Each report can be examined by Organization, Site, Category or Domain. Selecting one of these options from the dropdown menu will result in the report data and associated graphs being organized by the selected breakdown type.
Drill Down
Each report provides the option to drill down to multiple levels of detail, each level more detailed than the previous. For example, by starting with an Organization Breakdown report, you may use the drill down by buttons to explore data for a specific site, category, or domain which will appear within the displayed results.
After drilling down for more details, you may want to move up to a higher level of detail. To do so, click on any of the previously selected objects at the top of the report and choose Remove drill down.
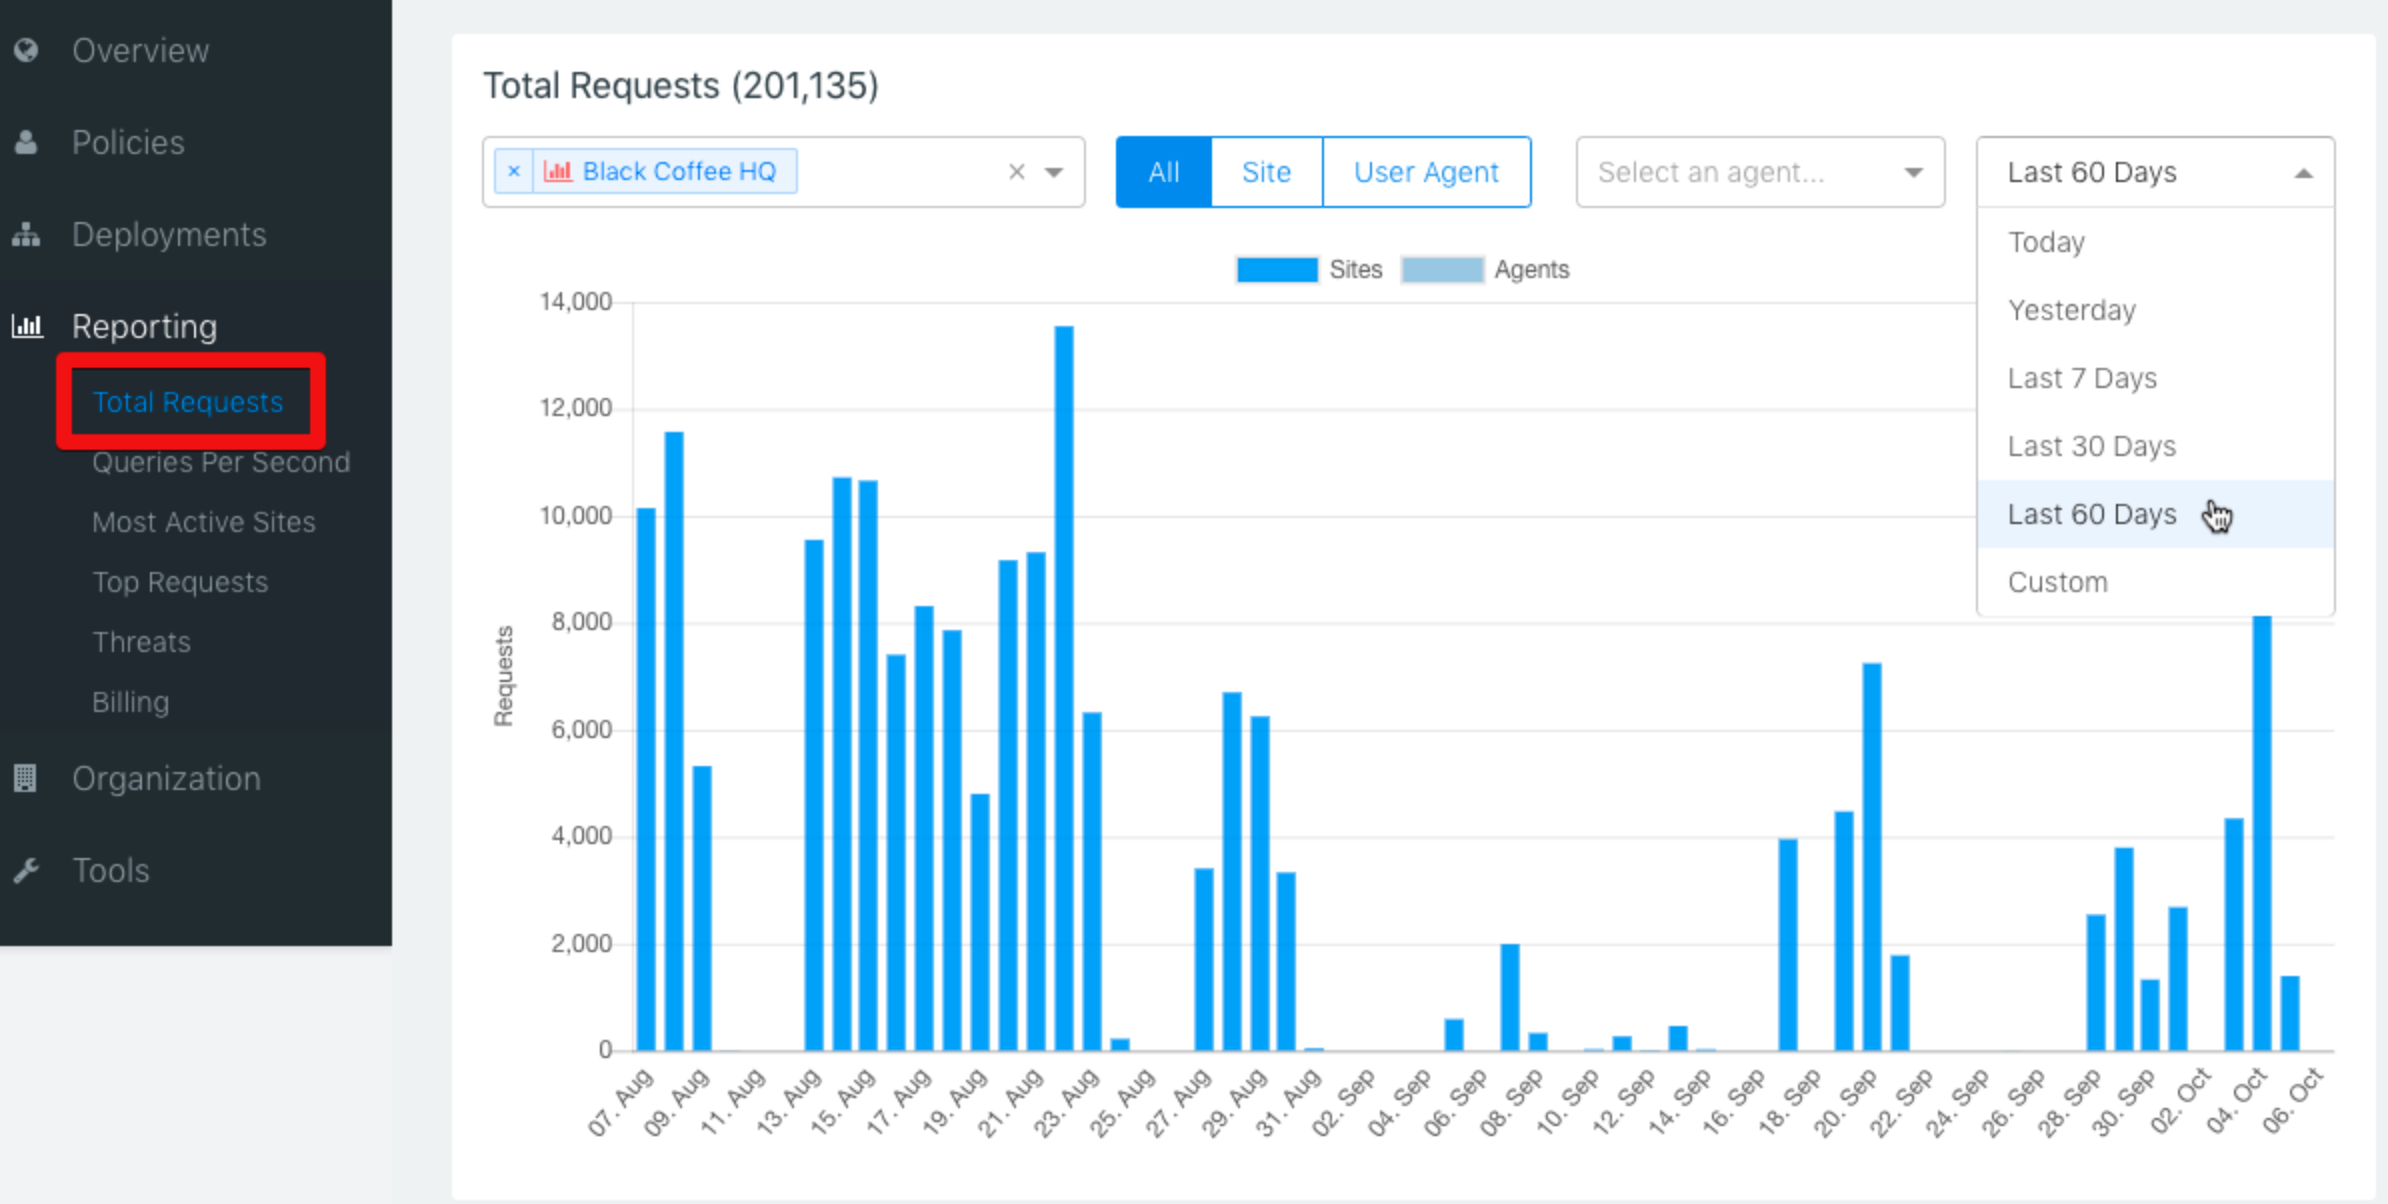
Total Requests
This report shows the total volume of query traffic from the selected Site/Roaming Client in a given time-period. It is useful for seeing which days of the week traffic fluctuates.
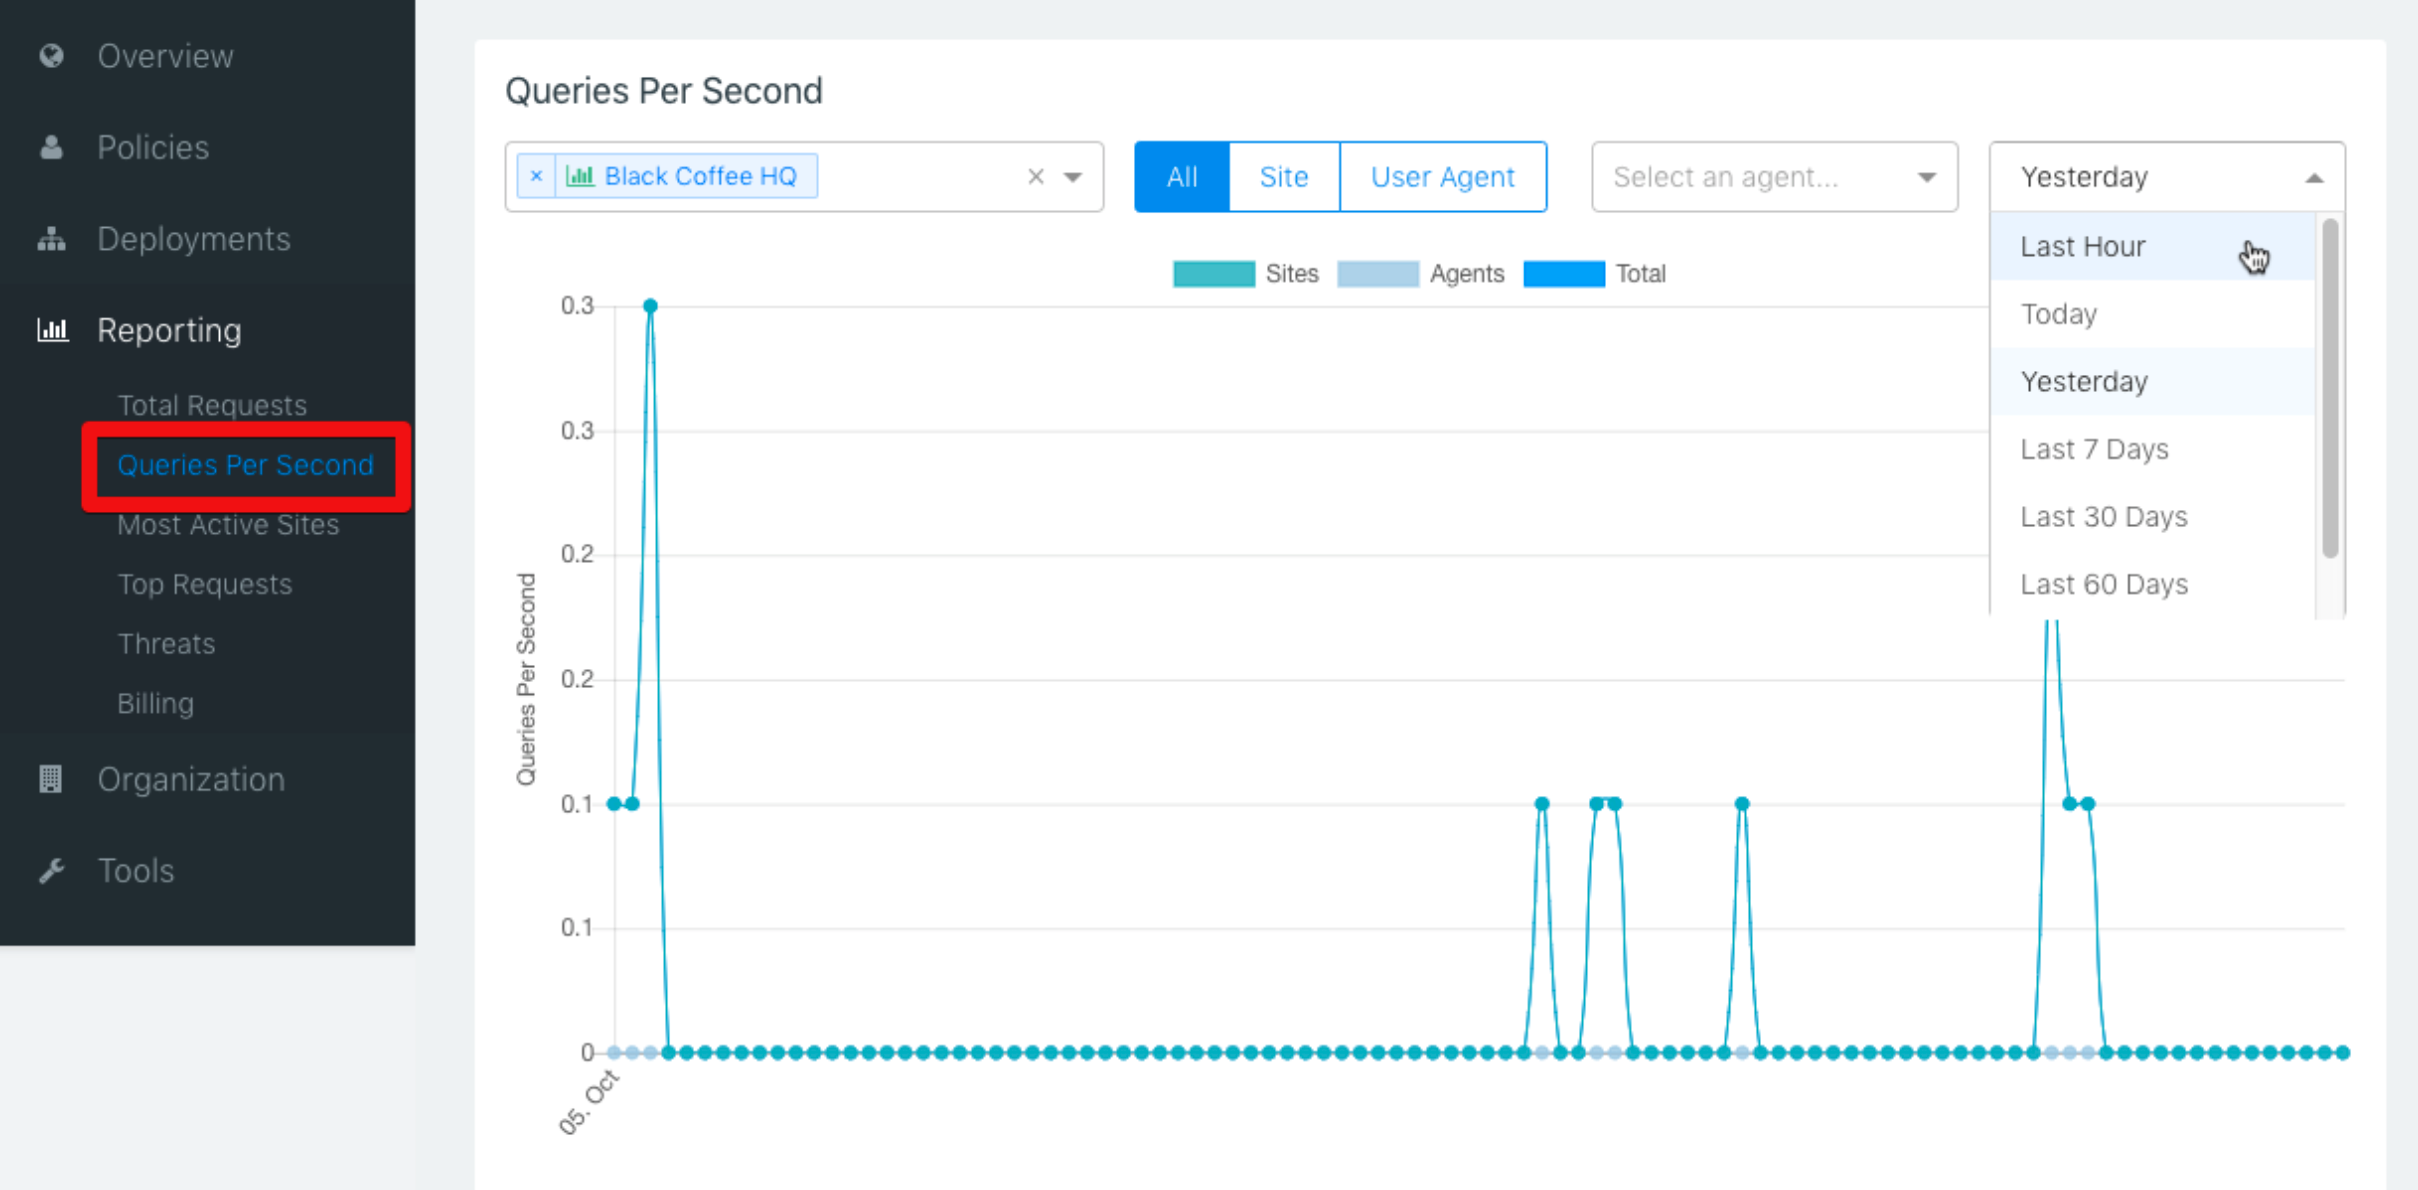
Queries Per Second
This report allows you to see the volume of traffic in a shorter time period, and is most useful for showing traffic in the last hour or day. You can see which times of day are the busiest.
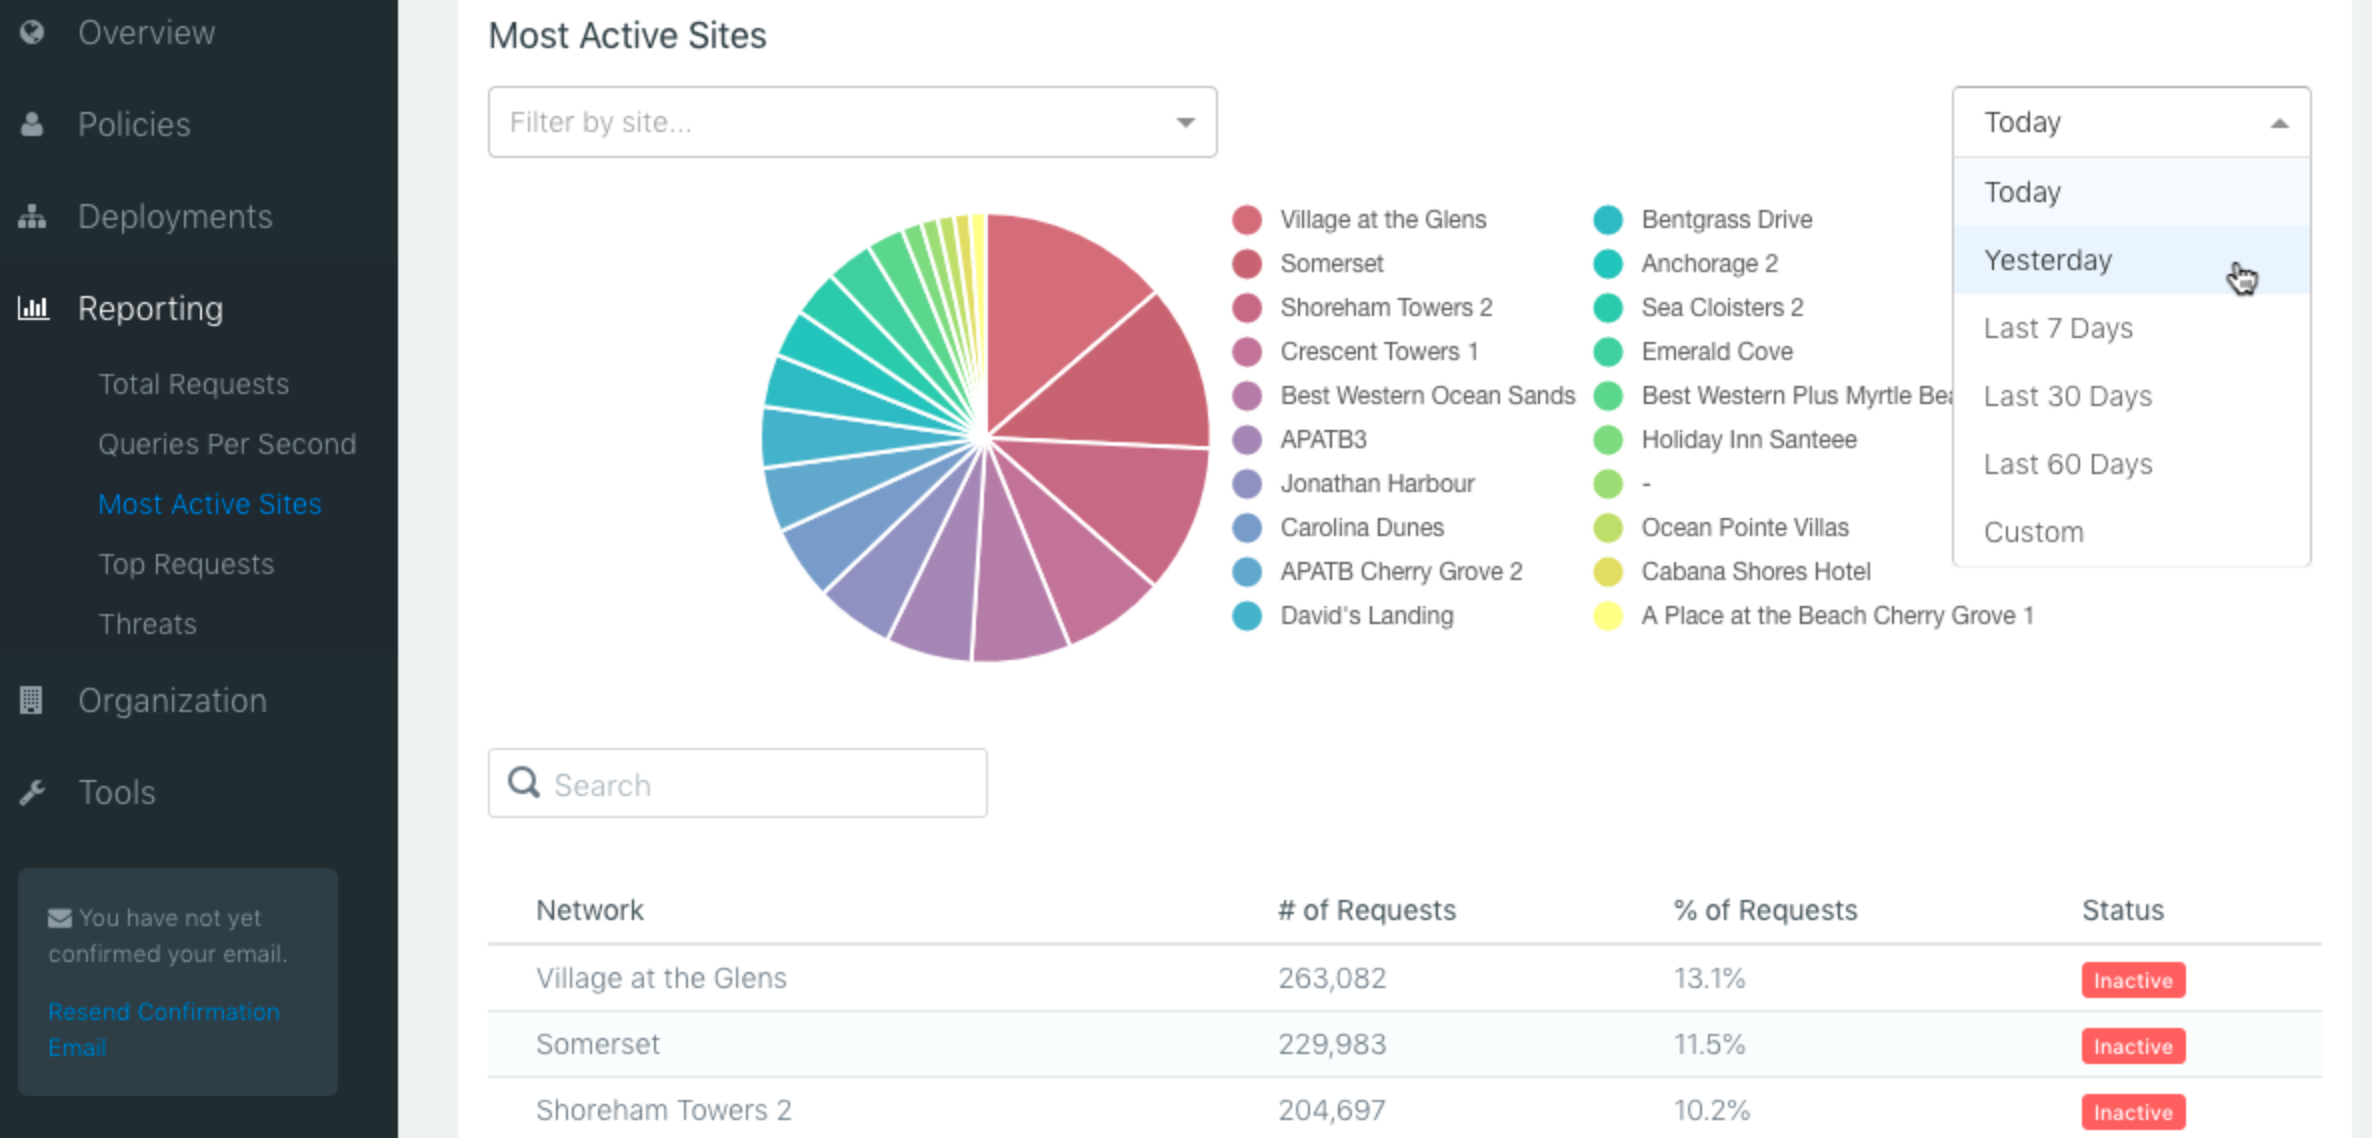
Most Active Sites
This report shows a pie-chart distribution of query traffic over all your sites in a selectable time period. It is useful for seeing which sites are sending the most traffic.
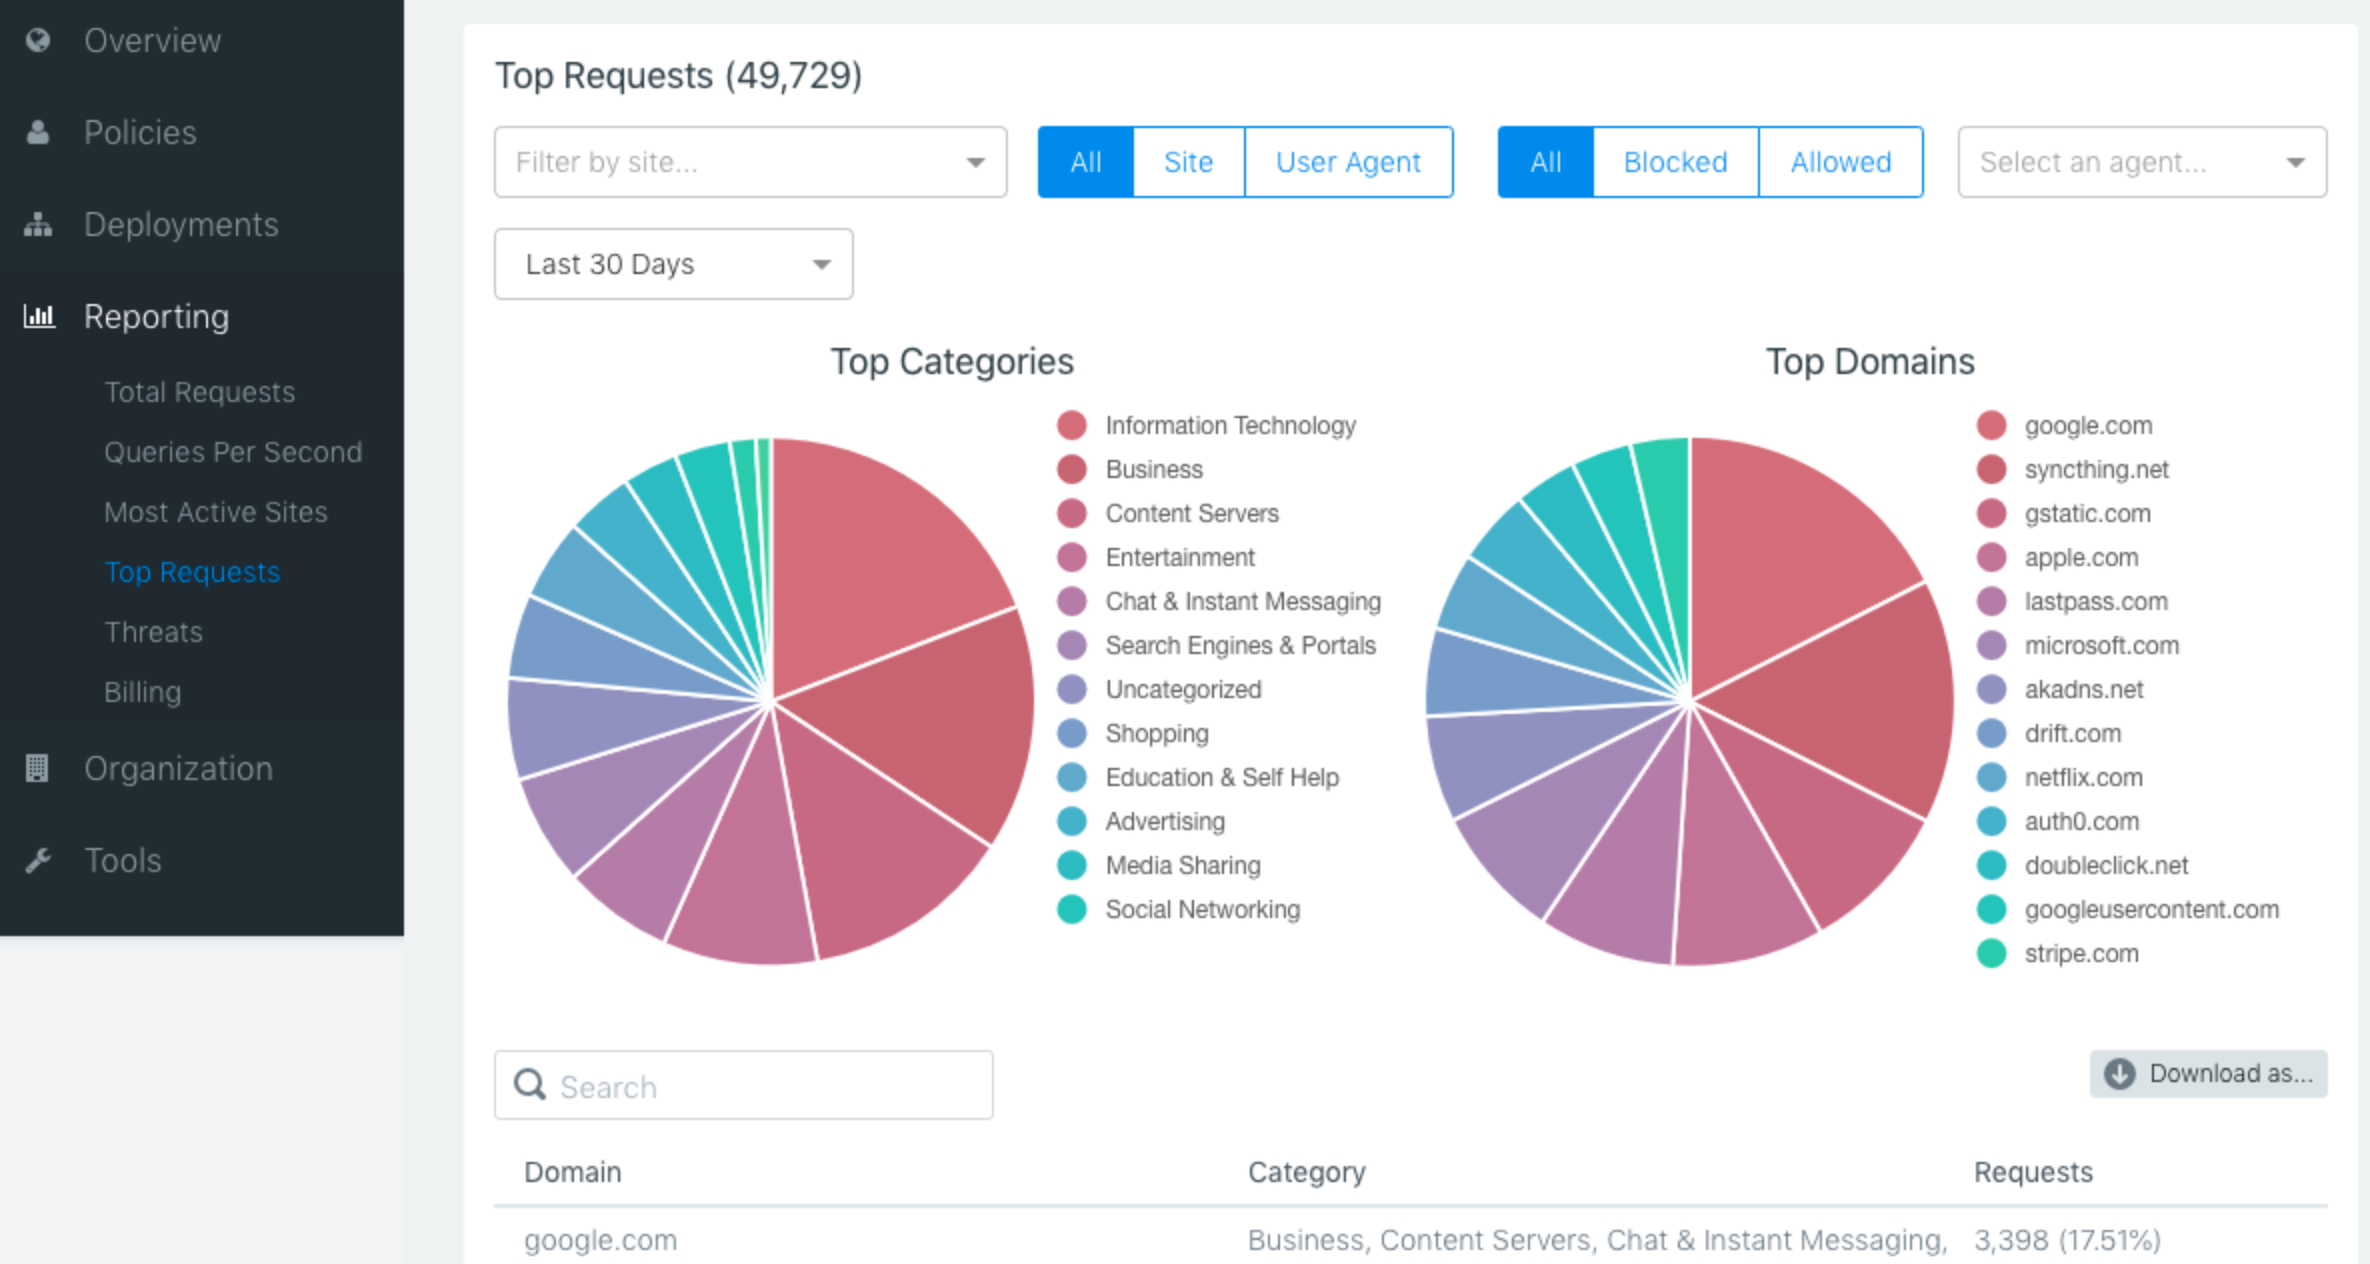
Top Requests
This report shows the most frequently requested domains across your account or filtered by site. You can adjust the timeline as well as filter by requests that were blocked or allowed. This is valuable in tweaking policies. If you see lots of requests for undesirable domains, you may want to adjust accordingly.
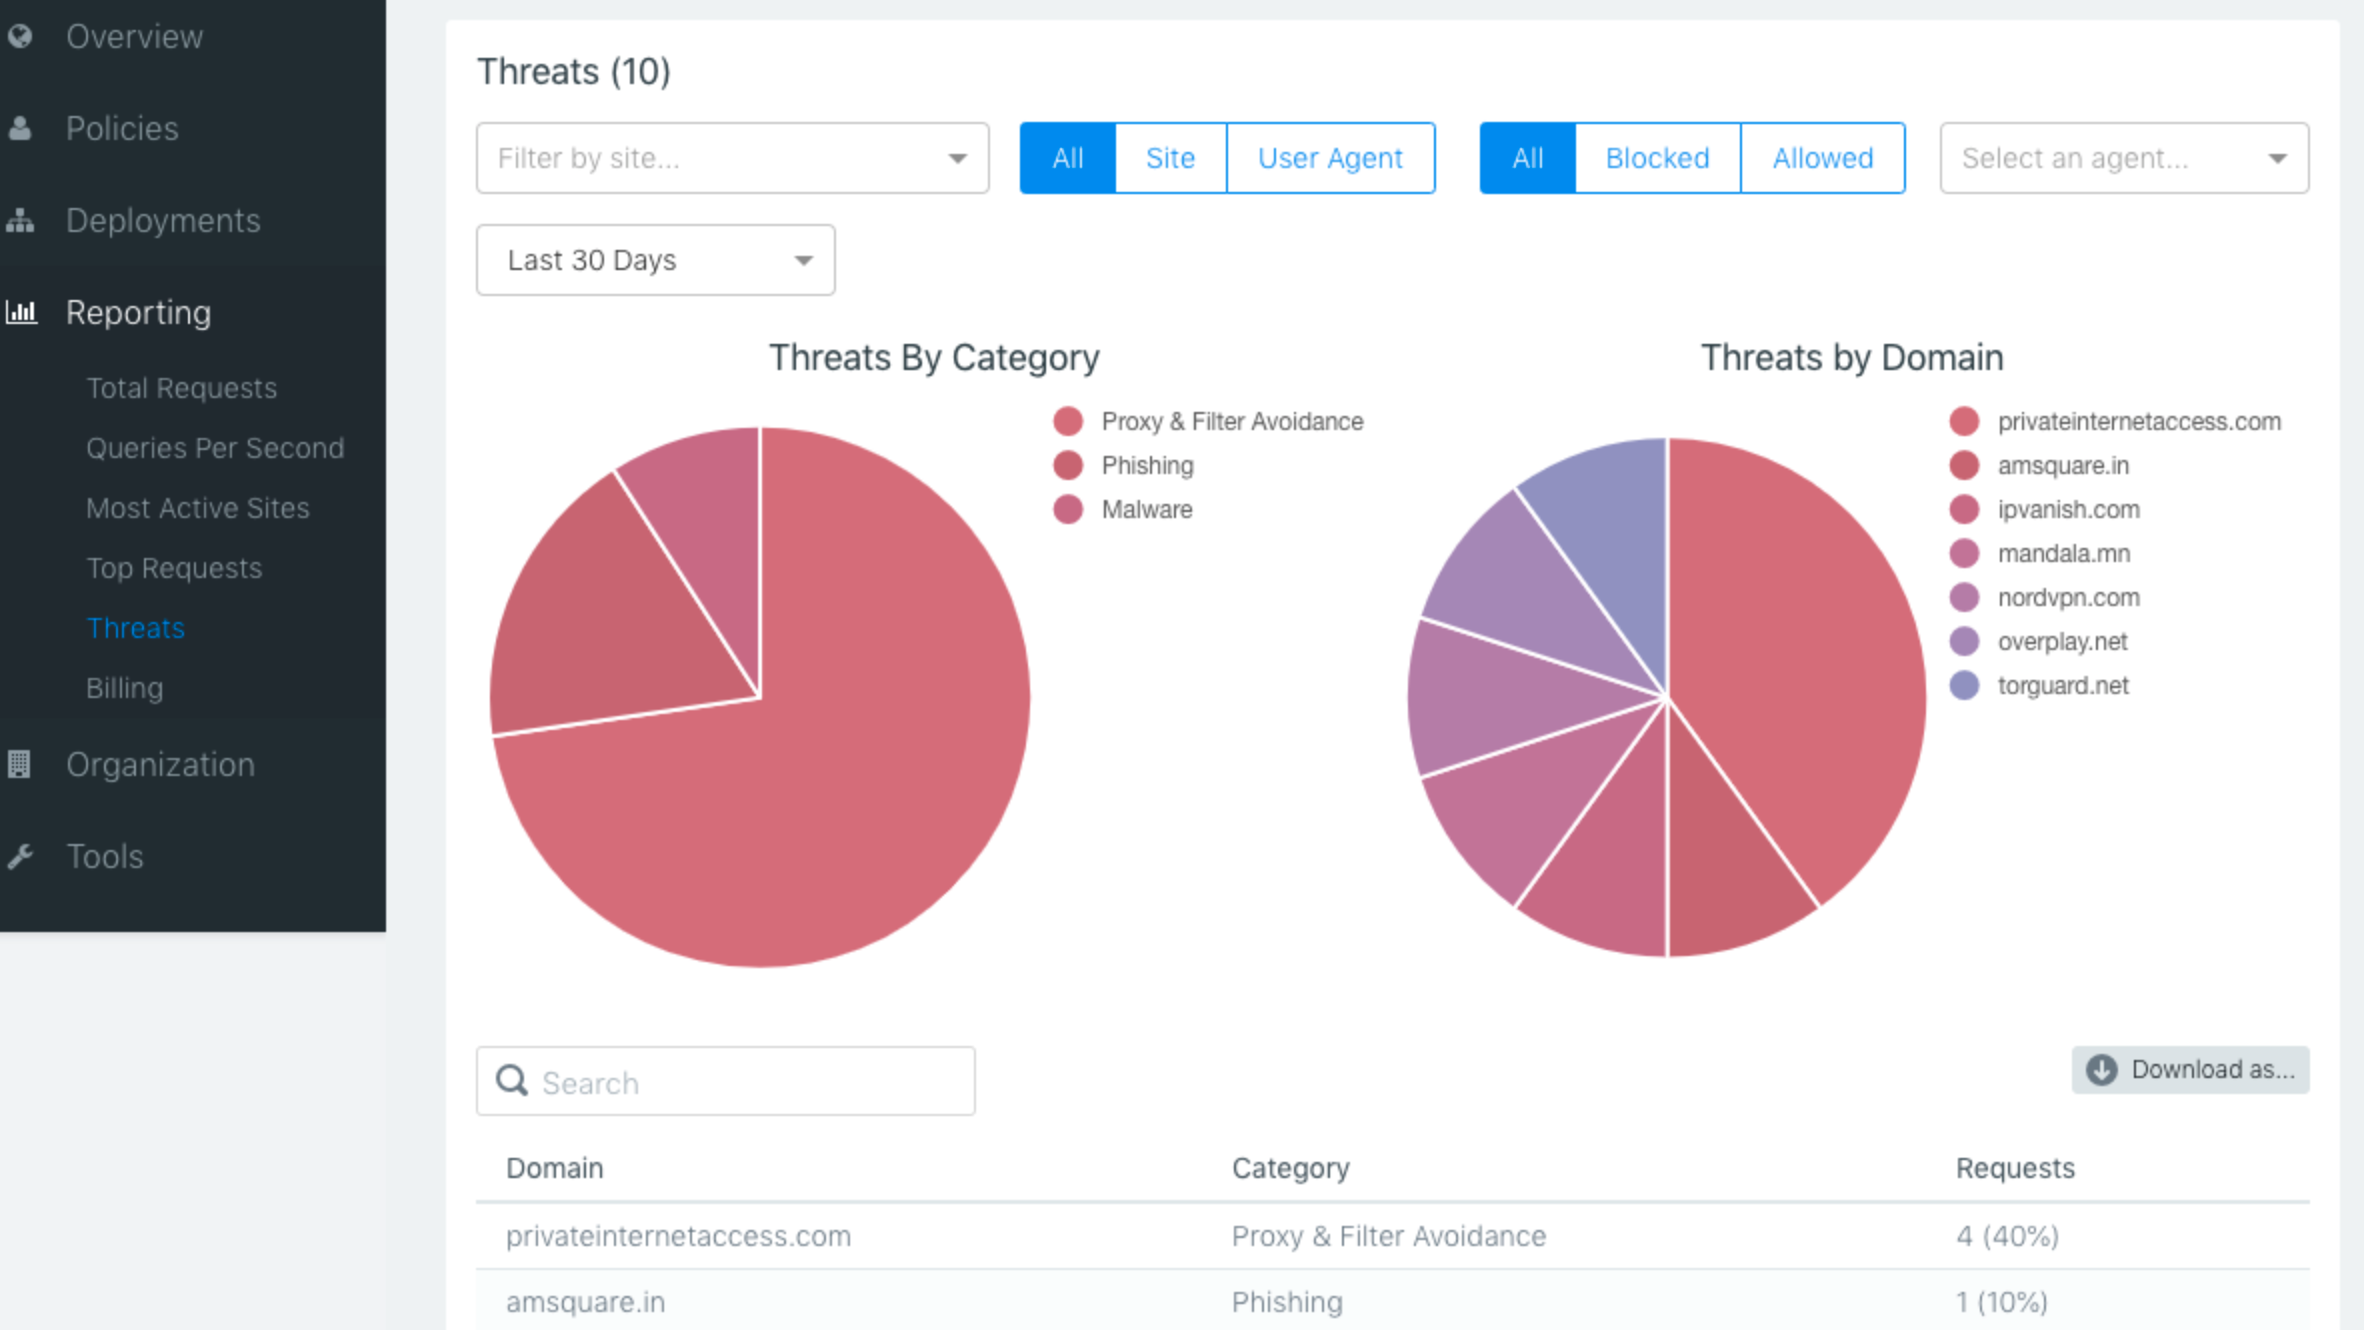
Threats
This report is similar to the Top Requests report, except broken down by threat domains. This is a valuable list showing threats that Smart Content Filter has prevented you from accessing.